
ILLIA TRETIAKOV
Founder

Retail turnover in Uzbekistan reached UZS 310.9 trn between January and July 2026, an increase of 20.2% in real terms on the same months of 2025, according to the National Statistics Committee's trade release for January to July 2026. Across the whole of 2025 the real increase had been 11.2%, so measured retail growth nearly doubled within a year. Over a similar period the committee's estimate of the unobserved economy, which covers unregistered household activity and concealed business activity, declined sharply.
It fell from 26.1% of gross domestic product (GDP) in the first half of 2025 to 22.9% a year later, as a business press summary of the committee's GDP release reports. Formalisation can change measured retail turnover where direct observation replaces or improves a statistical estimate, although it does not necessarily raise it. The published figures do not show whether that shift contributed to the 2026 acceleration or by how much. For an Uzbekistan market assessment, that uncertainty decides how much weight the headline number can carry for a company abroad.
This analysis, part of Tretiakov Consulting's work in Uzbekistan, asks how much of the demand measured in Uzbekistan a foreign entrant can realistically reach between 2026 and 2031, and what the official record shows about prices and competition before entry. It relies on releases of the statistics committee and international financial institutions, together with central bank data reported in the business press, and it names the points at which that record stops.

Source: National Statistics Committee of Uzbekistan, trade release for 2024, trade release for 2025 and trade release for January to July 2026, 2026 estimate by Tretiakov Consulting
A Retail Market Measured Every Month and Already Adjusted for Informal Trade
Retail demand in Uzbekistan is measured often and in some detail at the national level. The statistics committee publishes retail turnover every month, by region and by size of business, and the annual total rose from UZS 216.7 trn in 2021 to UZS 482.4 trn in 2025, as its trade release for 2024 and trade release for 2025 show. The 2025 total was equal to about 26% of GDP as measured in the committee's GDP release for 2025.
In real terms retail turnover grew fastest in 2021, by 17.0%, and has grown by roughly a tenth in each year since then. Converted at annual average official exchange rates, it was worth about USD 24 bn in 2021 and about USD 38 bn in 2025, according to an analyst review of Uzbek retail published in July 2026. The dollar series grew more slowly than the soum series because the currency weakened in most of those years before it strengthened in 2025.
A short note on definitions is needed before these figures are used for sizing. Retail turnover is the committee's measure of goods sold to households for personal use, including sales by individuals at farmers' markets and livestock markets, while catering and trade in motor vehicles are reported separately. Values in this article are nominal soum as published, growth rates are the committee's real rates in comparable prices, and dollar values follow the annual average official rate. Population figures are those published before the results of the current census. The analysis concentrates on consumer goods sold through retail channels and draws on wholesale and state-linked supply where they bear on prices and competition.
The most consequential detail for any sizing exercise sits in the metadata of these releases. The committee's trade releases for 2024, 2025 and 2026 state that turnover is calculated with the results of statistical estimates of the informal and shadow economy, as the release for 2025 records. An estimate of informal sales added on top of the official total would therefore count part of the same spending twice and overstate the market.
Part of the informal component is published separately, which makes its scale visible. In 2024 unorganised trade, meaning sales by individuals of produce and livestock from their own households, came to UZS 37.9 trn or 9.4% of retail turnover, according to the release for 2024. The releases do not show separately how much of the remaining total comes from the estimate of the shadow economy.
Why the 2026 Growth Rate Cannot Be Read as Demand Alone
The acceleration in 2026 arrived during a sharp contraction in the measured size of the unobserved economy. The committee's estimate of informal and shadow activity fell from 34.8% of GDP in 2024 to 26.9% in 2025, according to its GDP release for 2025 and a business press summary of the 2024 estimate. Almost all of that fall came from unregistered activity of households and individuals, while concealed business activity changed little.

Source: National Statistics Committee of Uzbekistan, GDP release for 2025, with 2024 and first half 2026 figures as reported in business press summaries of the committee's releases for 2024 and the first half of 2026
These figures describe the whole economy rather than retail trade. The committee classed 62.6% of agricultural value added as unobserved in 2025, against about a quarter in services, which include trade, according to the same GDP release. A smaller unobserved economy is therefore not in itself evidence of faster retail growth. Because retail turnover already contains an estimate of informal sales, a sale that moves onto a fiscal receipt changes the measured total only to the extent that the earlier estimate differed from what is now observed directly.
Several instruments were designed to move sales into the recorded economy. Online cash registers, a tax cashback scheme for buyers who register receipts, digital marking of selected goods and a zero rate of value added tax on some basic agricultural products from 1 January 2026 all push transactions into fiscal systems. The same analyst review attributes part of the acceleration to this formalisation and to an improved method of recording trade at traditional markets. A change of method can raise measured turnover where earlier estimates understated sales, but the size of any such effect is not published.
The committee's own releases describe the method only in general terms. No split between growth in spending and changes in statistical coverage could be located in public sources. The 2026 acceleration may therefore reflect changes in coverage and formalisation as well as underlying demand, and the releases do not allow those effects to be separated. Real household incomes, which the Asian Development Bank (ADB) reports rose by 9.2% in 2025, grew more slowly than retail turnover in that year, so the gap between income growth and measured sales growth predates 2026.
A second check, based on the committee's own earlier release, adds a further reason for caution. The 2026 total for January to July is 31.6% higher in nominal terms than the figure first published for the same months of 2025. With consumer inflation near 6%, that gap cannot be reconciled with real growth of 20.2% simply by applying headline inflation, because the price index used to deflate retail turnover need not match the consumer price index. It may reflect revisions to the 2025 base, differences between the two price measures, changes in the composition of sales or other methodological effects, none of which are explained in the published releases.
For the full year, the first seven months accounted for 49.0% of the annual total in 2025. Applying that share to the 2026 data gives a Tretiakov Consulting estimate of about UZS 635 trn for the year, a figure that will move with the next monthly releases and with any revision to the 2025 base. The chart at the top of this article shows that estimate against the actual annual totals since 2021.
Geography and Channels Narrow the Addressable Market
The regional split in the committee's data narrows the national total sharply. Tashkent city generated about a quarter of retail turnover in 2024, according to the release for 2024, while it held 8.3% of the population on 1 July 2026 in the committee's demographic release. Retail turnover per resident in the capital was 3.2 times the national average in 2024.
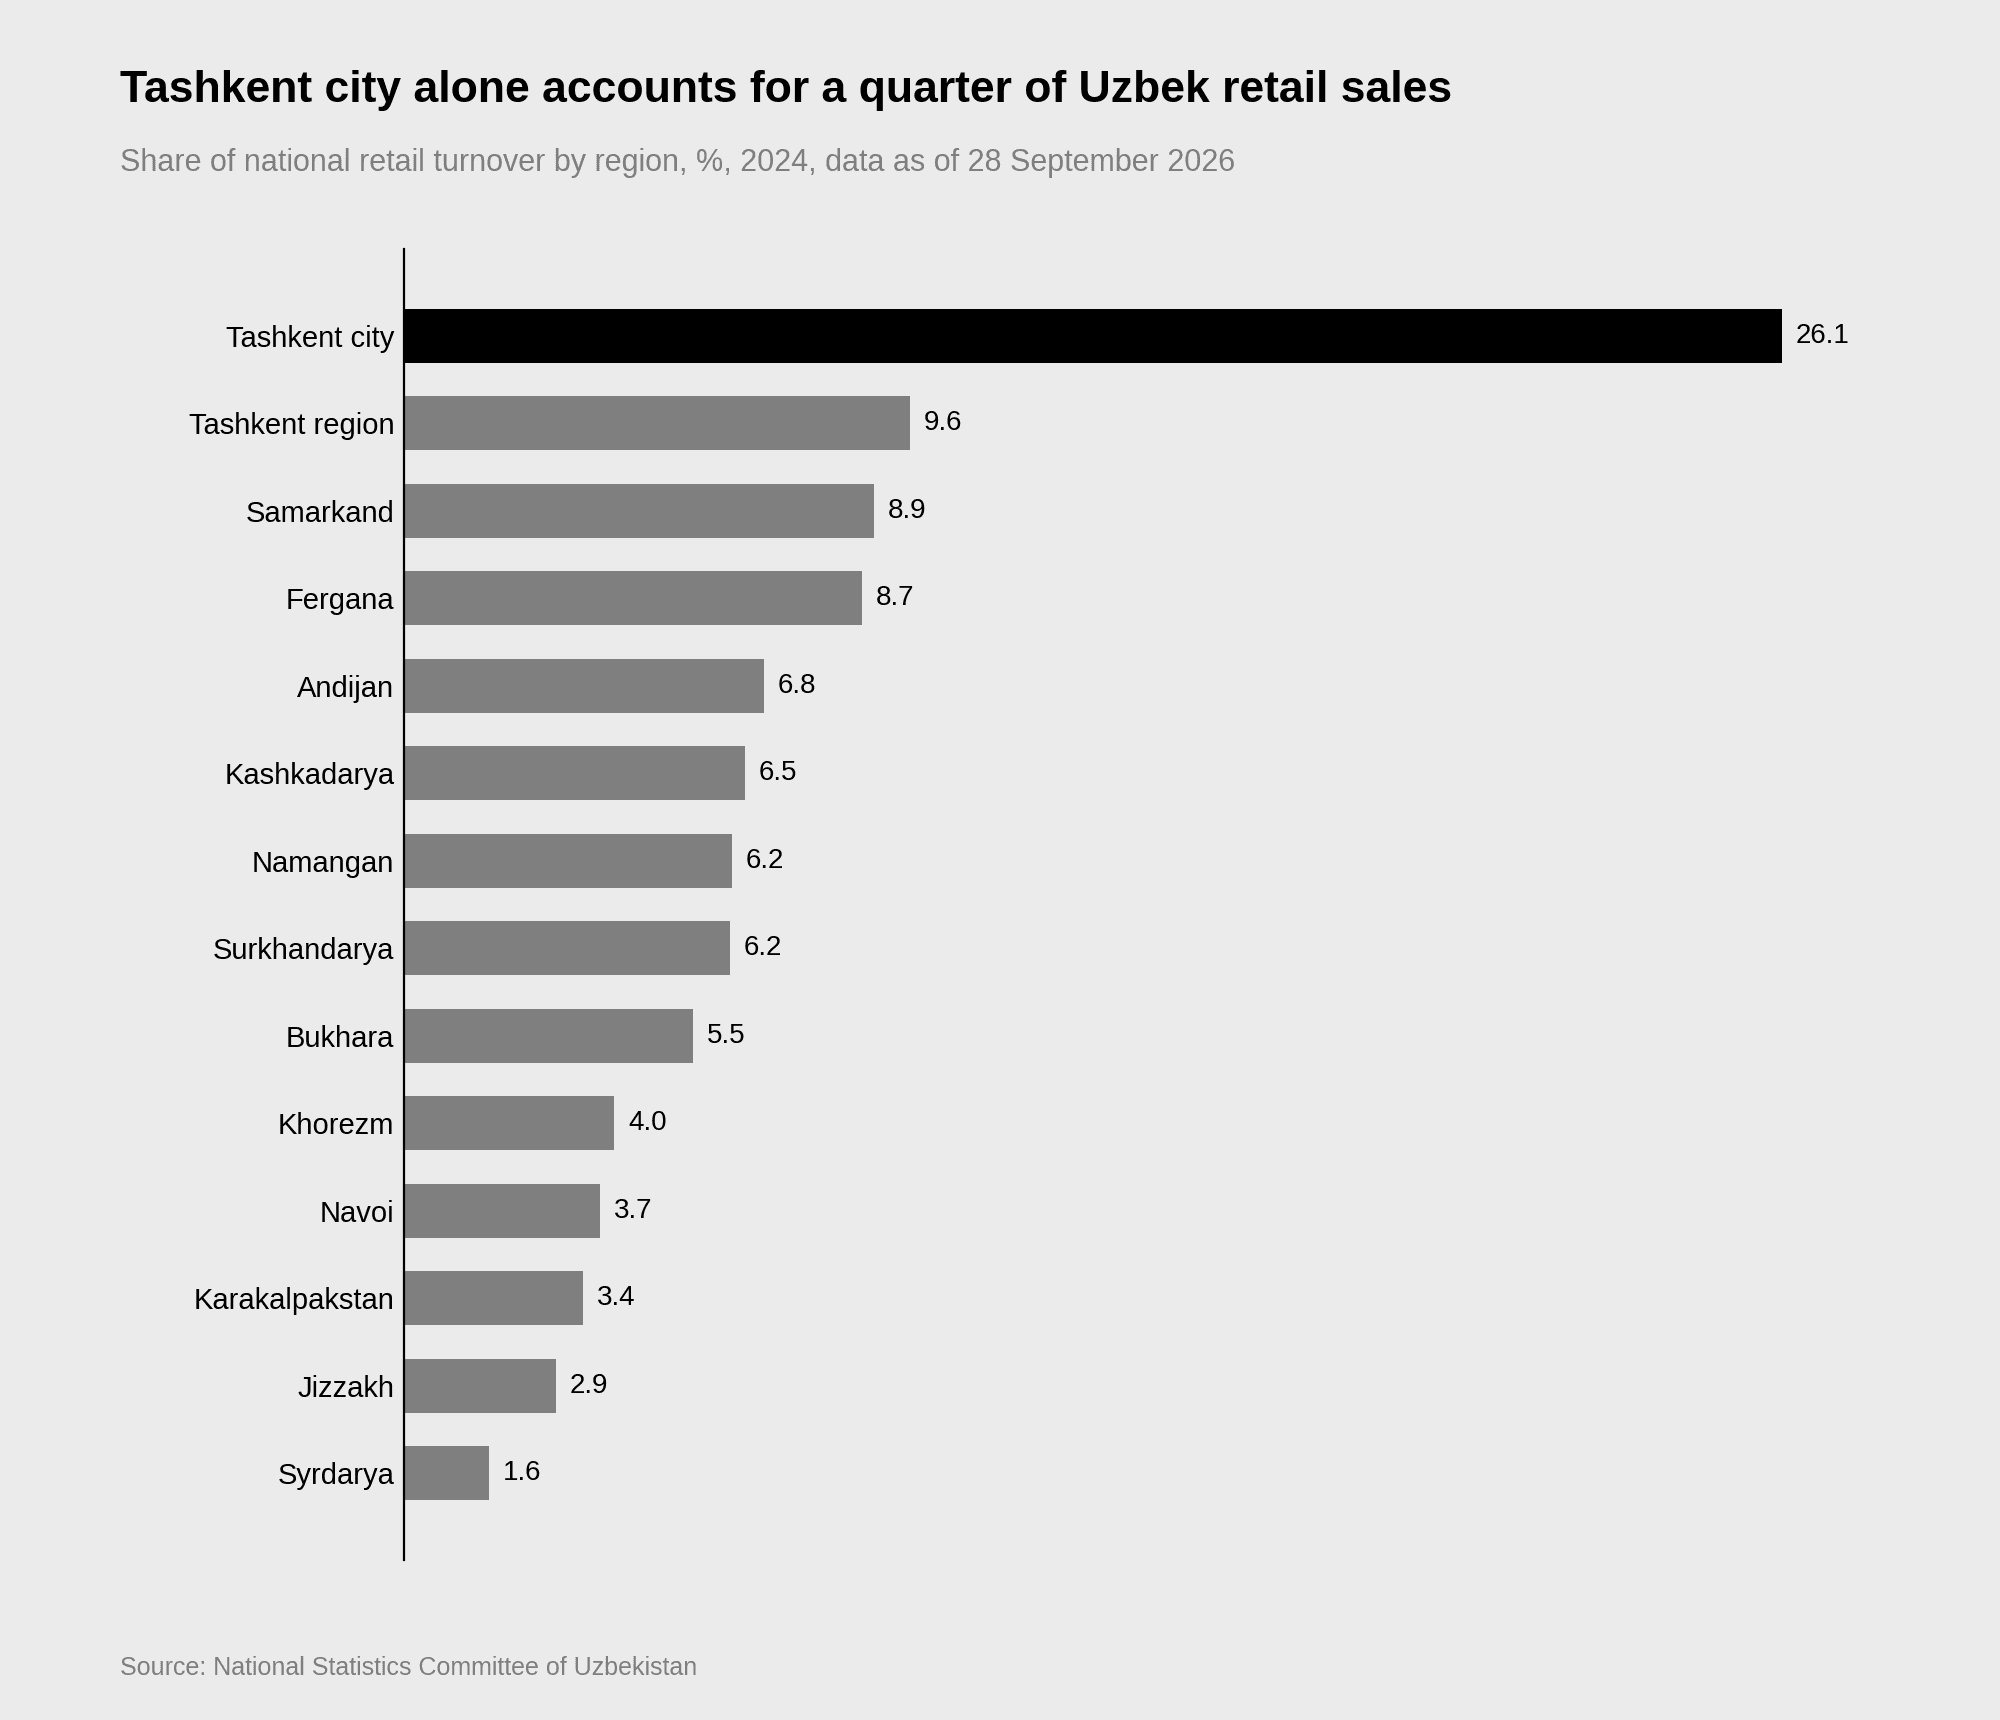
Source: National Statistics Committee of Uzbekistan, trade release for 2024
Five territories, namely Tashkent city, Tashkent region, Samarkand, Fergana and Andijan, together produced about 60% of national retail turnover in 2024. The remaining territories, home to slightly more than half of the population in 2026, generated about two fifths of sales. The review links their lower totals to lower incomes, a larger informal share and weaker logistics infrastructure.
The sales channel is the second dimension that shapes the addressable market. Traditional markets and trading enterprises now account for almost equal shares of retail sales, with e-commerce below 5%, based on committee data compiled by the same analysts. Markets had carried 69% of sales in 2016, so the shift towards registered stores has been substantial. Whether an entrant can use traditional markets depends on the category and on the route through importers and wholesalers, and the choice of that route is examined in the analysis of distributor selection in Uzbekistan. The channel data therefore describe how sales are made rather than a fixed boundary on what can be reached.

Source: Retail sector review, July 2026, based on National Statistics Committee data
Business size is the third dimension in the published data. Large enterprises accounted for 16.0% of the total in 2024, 17.0% in 2025 and 17.8% in the first seven months of 2026, according to the committee's releases for 2025 and 2026. For consumer, retail and distribution businesses, the addressable market for a category has to be estimated through these three dimensions, and their weight differs by category and route to market. The published data allow that market to be bounded but not measured, because the regional and channel data are released separately and are not cross-tabulated. Estimating it for a single category is the point at which a market assessment within an entry mandate moves from national statistics to category evidence.
Household Budgets Built on Food, Transfers and Credit
Household budgets explain why price matters more than the growth figures suggest. Food accounted for 56.5% of consumer spending in 2025, up from 47.3% in 2016, according to household survey data summarised in the analyst review of Uzbek retail. Non-food goods and services shared the remainder, which leaves limited room in the typical budget for discretionary purchases. Wage growth and labour costs are covered in the analysis of doing business in Uzbekistan.
Transfers from abroad are a significant source of purchasing power. Cross-border remittances reached USD 18.9 bn in 2025, 27.2% more than a year earlier and more than 12.8% of GDP, according to central bank figures reported in a business press summary. Part of family spending in Uzbekistan therefore depends on the earnings of citizens working abroad.
Consumer credit has stopped expanding faster than the economy. Retail loans reached UZS 220.3 trn in 2025, equal to 11.9% of GDP, and have stayed close to 12% of GDP for three years, based on central bank data compiled in the same review. Its role is largest for durable goods such as household appliances, electronics and cars, where purchases are often financed in instalments.
The population behind these budgets is still growing, although births are falling. The committee counted 38.5 m residents on 1 July 2026, while births in the first half of 2026 fell to 373,400 from 405,500 a year earlier, according to its demographic release. These population figures carry a caveat that affects every per capita ratio in this article. Under a Cabinet of Ministers resolution of 7 October 2025, final results of the population and agricultural census are due by 1 July 2027, and the committee states that current figures are compiled from justice and interior ministry records without census results. Per capita spending and regional shares of population will therefore be recalculated on the census base once the results are published.
Price Evidence Is Strong for the Basket and Thin for the Category
Consumer price data are the strongest part of the public record for anyone testing a price position. Annual inflation eased from 12.3% in 2022 to 7.3% in 2025, as the retail review and ADB record, and the committee's consumer price release for August 2026 puts it at 6.2% year on year. Inflation has therefore roughly halved since 2022 while remaining above the central bank's target.
The composition of inflation changed sharply over the past year. Prices of services rose by 6.4% in the year to August 2026 against 16.2% a year earlier, while prices of goods rose at close to the headline rate. Currency movements now affect import prices in both directions, and the soum appreciated by 6.9% against the dollar in 2025, according to the International Monetary Fund (IMF), which lowered the soum cost of dollar-priced imports in that year.
Regional price movements are narrow enough for a national index to describe them reasonably well. Annual inflation in August 2026 ranged only from 5.2% in Syrdarya region to 6.8% in Tashkent city. An index of price changes says nothing about differences in price levels between regions, however, and the regional tables report changes rather than levels.
The index itself became a richer source of evidence in 2026. Since January it has covered 517 goods and services and more than 2 m price quotations a month, according to the August 2026 release. The quotations come from store visits, retailer data feeds and web scraping, and also from transaction data in online cash register receipts held by the tax authorities.
The release also shows what receipt-level data can reveal about price dispersion. For petrol it used 21,753 price quotations from filling stations, and the retail price of regular-grade petrol ranged from UZS 10,500 to UZS 16,400 a litre in August 2026. No comparable published ranges for other consumer categories were found, although online cash registers generate such receipts across registered retail.
Digital marking extends state visibility to the movement of selected goods. According to the Tax Committee, tobacco and alcohol have been marked since 1 January 2021 and beer since 1 April 2021. Household appliances followed on 15 April 2022, medicines and medical devices on 1 September 2022, and bottled water and soft drinks on 1 March 2024. Aggregated sales data from the marking system were not found in public sources, so the codes applied to these goods are not a public data source for sizing a category.
Competition Is Fragmented at the Shelf and More Concentrated in Wholesale
Registered retail in Uzbekistan remains highly fragmented by the committee's own counts. On 1 August 2026 the register held 90,683 retail businesses, of which 424 were classed as large, according to the release for the first seven months of 2026. Concentration rises one step further up the supply chain. Large enterprises handled about a quarter of wholesale turnover in the same period, compared with less than a fifth of retail sales, so by this measure the wholesale stage is more concentrated than the shelf.
The legal framework for competition was renewed three years ago. The Law on Competition of 3 July 2023 replaced the 2012 statute from 4 October 2023, as the legislative record shows. The competition authority's current register of dominant entities and any market studies by product category were not found as public datasets, so formal concentration measures for specific categories are not available to an outside assessment. Tax data offer a partial view of the activity of individual retailers. The analyst review used receipts registered through the tax authority's mobile application to compare the five largest store chains, and it notes that such data describe receipts and cashback rather than market shares.
Beyond retail, the Asian Development Bank lists reform of state-owned enterprises and improved market competition among the conditions for sustaining productivity-driven growth in Uzbekistan. The route by which foreign investors can acquire state assets is described in the article on privatisation in Uzbekistan. How local content rules and state purchasing shape price competition for suppliers is set out in the analysis of production localisation in Uzbekistan. The choice between distributor, subsidiary and partner routes is examined in the review of market entry consulting in Uzbekistan.
Regional comparison places Uzbekistan's channel structure in a wider Central Asian and Caucasus context. Traditional markets carry a larger share of retail in Uzbekistan than in Kazakhstan, where the same review puts it at 37%, or Azerbaijan at 22%, and a smaller share than in Tajikistan at 70%. The figures come from different national agencies, so these comparisons describe direction and are not a benchmark for Uzbekistan. The Kazakh market is examined in a separate market opportunity assessment for Kazakhstan.
What Is Scheduled to Change the Base to 2031
Published forecasts point to continued growth in output, which supports the incomes behind retail demand. After its 2026 Article IV mission the IMF projected real GDP growth of 6.8% in 2026 and around 6% in 2027. Its April 2026 World Economic Outlook tables show growth easing to 5.7% by 2031.
The April 2026 outlook of ADB is slightly higher for 2027, at 6.8%, and expects inflation to slow to 6.5% in 2026 before converging on the central bank's 5% target in 2027. That target is a policy objective and not an outcome, and inflation has been above it throughout the period since 2022. With food taking more than half of household consumer spending, the inflation path bears directly on what households have left for other purchases.
No published forecast of retail turnover beyond 2026 was found in the material reviewed for this analysis. The outlook for the main indicator of this article therefore rests on projections of output, inflation and population, which set the direction of demand but not its level in any category. Several scheduled events will also change the statistical base itself. The census results due by 1 July 2027 will restate population and every per capita ratio. The consumer price method introduced in January 2026 will lengthen its record of receipt-based prices, and any further formalisation will shift activity from estimated to directly observed parts of the statistics.

Source: National Statistics Committee of Uzbekistan, Tax Committee, Asian Development Bank and legislative record
Accession to the World Trade Organization (WTO) remains a declared objective for 2026 and had not been completed by late September. On 25 September 2026 the head of the presidential administration discussed the remaining work with the WTO director-general, according to a regional news report, and until a protocol is concluded import duties and market access conditions remain under current national rules. ADB describes accession as a way to anchor reforms, improve competitiveness and attract higher-quality investment, and the tariff commitments of a completed accession would affect the landed price of imported goods.
Conclusion
The evidence reviewed shows that Uzbekistan does not lack market data at the national level. Its retail series is monthly, regional and already adjusted for informal trade, and it describes a market of about UZS 482 trn in 2025 that is on course, by a Tretiakov Consulting estimate, to exceed UZS 600 trn in 2026. The part of that total a foreign entrant can address is narrower and depends on category, geography and route to market. About a quarter of retail sales happen in the capital and close to half still pass through traditional markets, while food takes more than half of household consumer budgets. The 2026 acceleration may reflect changes in statistical coverage and formalisation as well as underlying demand, but the published data do not allow those effects to be separated.
The public record bounds the addressable market by region, channel and business size but does not measure it for any single category, because category aggregates from receipt and marking data are not published. Receipt-level data already collected by the state could potentially support more granular category analysis, but comparable aggregates are not published. The difference that decides an entry case in Uzbekistan is therefore between a market that is well counted and a category that is still unmeasured.
Tretiakov Consulting tests addressable demand, pricing and partner options before a company commits to Uzbekistan. Discuss a market assessment
Our insights